
Portfolio
Portfolio Theory
Concept of Risk
In finance, risk refers to the possibility of losing money or not getting expected returns from an investment. It's the uncertainty associated with future returns.
- Return = Reward
- Risk = Uncertainty or chance of loss
Components of Risk
Risk is mainly divided into two components:
| Component | Meaning | Example |
|---|---|---|
| Systematic Risk | Market-related risk; cannot be diversified | Inflation, interest rates, recession |
| Unsystematic Risk | Company-specific or industry-specific risk; can be diversified | Poor management, labor strike |
Measurement of Risk
The most common measures of risk in finance:
| Risk Measure | Description |
|---|---|
| Standard Deviation (σ) | Measures how much the return deviates from the average. Higher σ = higher risk. |
| Variance (σ²) | Square of standard deviation. Used to calculate portfolio risk. |
| Beta (β) | Measures how much a security moves relative to the market. Beta > 1 means more volatile than market. |
Covariance
- Covariance measures how two securities move together.
- If positive, they tend to move in the same direction.
- If negative, they move in opposite directions.

Correlation (ρ)
- Correlation coefficient is a standardized form of covariance.
- It ranges from -1 to +1.
| Value of ρ | Interpretation |
|---|---|
| +1 | Perfect positive correlation |
| 0 | No correlation |
| -1 | Perfect negative correlation |

Fundamental Coefficient (Beta - β)
- Beta is a key coefficient in portfolio theory.
- Measures the systematic risk of a security compared to the market.
| Beta (β) | Meaning |
|---|---|
| = 1 | Same risk as the market |
| > 1 | More volatile than the market |
| < 1 | Less volatile than the market |

Where:
-
: Return on asset
-
: Return on market
-
: Variance of market return
Summary Table

Measurement of Systematic Analysis
Economic Analysis
Economic analysis studies macroeconomic factors affecting the overall financial market.

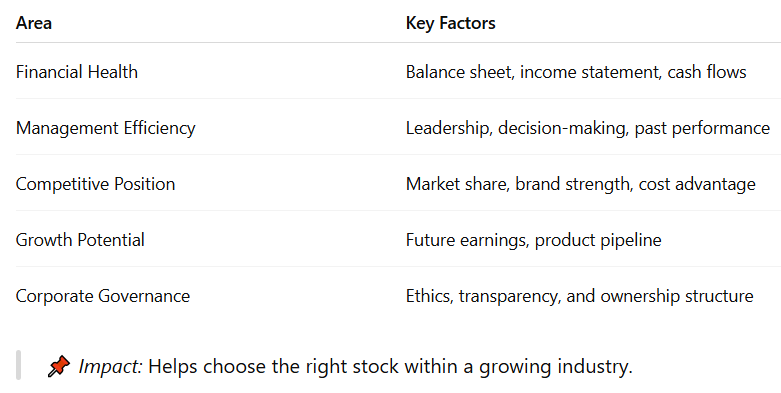
Industry Analysis
Key Factors

Company Analysis
Key Areas
Portfolio Risk and Return
Return of a Portfolio

Where:
-
: Portfolio return
-
: Weight of asset in portfolio
-
: Return of asset
Portfolio Risk (Standard Deviation)

Where:
-
: weights of assets
-
-
: correlation between assets
Beta as a Measure of Systematic Risk
Interpretation

Formula

Where:
-
: Return of the asset
-
: Return of the market
-
: Variance of market return
📌 Use of Beta: Helps in Capital Asset Pricing Model (CAPM) to find expected return:


Calculation of Beta (β)
Beta measures a stock’s sensitivity to market movements. It shows how much a security’s returns change in relation to market returns.
Formula:

Where:
-
: Return of the individual asset
-
: Return of the market
-
Cov: Covariance between asset and market
-
Var: Variance of the market
Alternative (Regression-Based) Formula:

| Beta Value | Meaning |
|---|---|
| β = 1 | Moves exactly like the market |
| β > 1 | More volatile than the market (aggressive) |
| β < 1 | Less volatile (defensive) |
| β = 0 | No market sensitivity |
| β < 0 | Moves opposite to market |
Selection of Portfolio
- A. Markowitz’s Modern Portfolio Theory (MPT)
- Proposed by Harry Markowitz in 1952
- Focuses on diversification to reduce unsystematic risk
Key Concepts:
- Investors are risk-averse
- Portfolio return is weighted average of individual returns
- Portfolio risk depends on variance and correlation
Efficient Frontier
- A graph showing optimal portfolios that offer the highest return for a given level of risk.
- Portfolios below the frontier are sub-optimal.
- The tangent to the frontier from the risk-free rate gives the optimal risky portfolio.
Portfolio Return:

Portfolio Risk (2 assets)

Goal: Minimize σp for a given Rp → choose assets with low or negative correlation
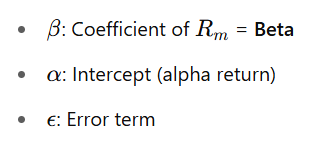
- B. Single Index Model (Sharpe’s Model)
- Proposed by William Sharpe
- Simplifies Markowitz model by assuming that stock returns are influenced only by the market index (like Nifty/Sensex)
Formula

Advantages Over MPT

