
Capital Market & Asset Pricing
Capital Market & Asset Pricing
Technical Analysis is the study of historical price and volume to predict future price movements in the financial markets. It is based on the belief that "price reflects all information".
Dow Theory
Developed by Charles Dow, it is the foundation of modern technical analysis.
Six Basic Principles of Dow Theory

Support and Resistance Levels
Support Level
"Floor" of the market
Resistance Level
"Ceiling" of the market
| Term | Meaning |
|---|---|
| Support | Buying zone, price bounces back upward |
| Resistance | Selling zone, price falls from the top |
Traders use these levels to enter or exit trades.
Types of Charts & Their Interpretations
A. Line Chart
- Plots only closing prices over time.
- Simple but lacks detail.

B. Bar Chart
- Shows open, high, low, close (OHLC) for a given period.
- Useful for detailed trend analysis.

C. Candlestick Chart
- Most popular chart type.
- Visual representation of price movement in a time frame.

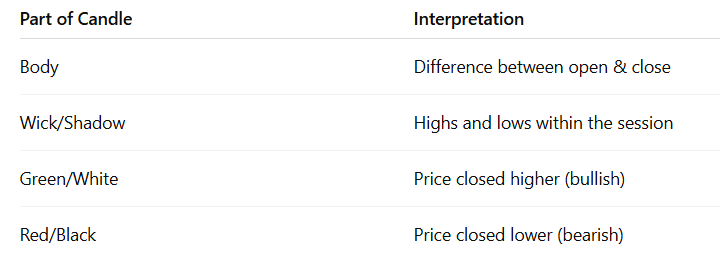
Common Candlestick Patterns (Interpretation)


Capital Market & Technical Analysis
Trend Line
Types of Trend Lines

Gap Theory (Price Gaps)
Types of Gaps

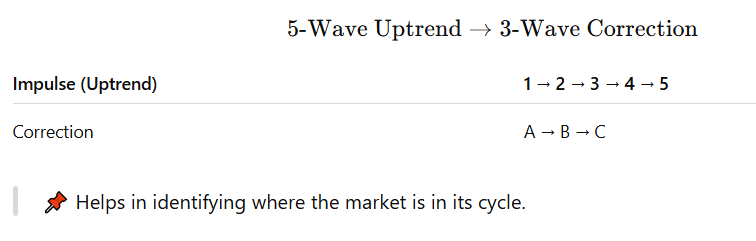
Wave Theory (Elliott Wave Theory)
Wave Patterns
- Impulse Waves (5 waves): Direction of the main trend
- Corrective Waves (3 waves): Move against the trend
Pattern:
Relative Strength Analysis (RSI)
RSI Scale: 0 to 100

Technical vs Fundamental Analysis

Nature of Stock Markets & EMH (Efficient Market Hypothesis)
What is a Stock Market?
What is Efficient Market Hypothesis (EMH)?
In simple words:
- You can’t consistently beat the market because whatever you know, the market already knows.
- Prices are fair most of the time.
Three Forms of EMH

Implications of EMH on Investment Decisions:

Criticism of EMH (Why Some People Disagree)

Real-Life Example
- In an efficient market, the stock price immediately adjusts to the news.
- So, by the time you decide to buy the stock tomorrow, it's already too late to profit.
What Should Investors Do (MBA Perspective):
- Don’t chase hot stocks or rumors
- Diversify your portfolio to reduce risk
- Invest in index funds or ETFs (especially if you believe EMH)
- Avoid frequent trading unless you have solid, proven strategies
- Use fundamental analysis for long-term investing (if you believe markets are not fully efficient)
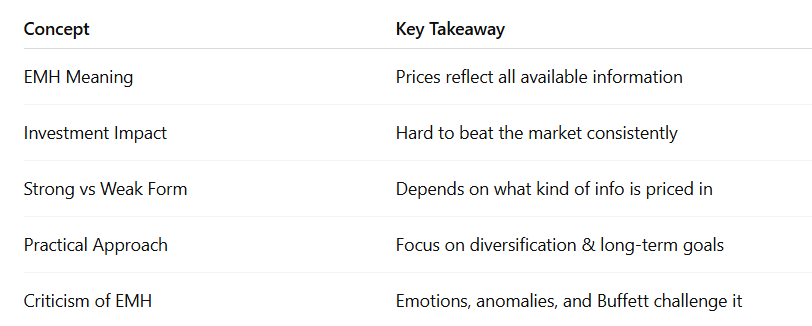
Efficient Market Hypothesis is not a trading strategy but a philosophy. It encourages passive investing, staying rational, and believing that the market is usually right — though not always perfect.
Capital Market Theorem, CAPM & APT
The Capital Market Theorem is based on Modern Portfolio Theory and leads to the Capital Market Line (CML).
📌 What is it?
Imagine you're choosing from thousands of investments (stocks, bonds, etc.). The theorem says:
"There is one best line (the CML) that shows the highest return for every level of risk."
CML = Risk-free return + (Market risk premium × Portfolio risk)
Where:
-
: Portfolio return
-
: Risk-free rate (e.g., government bond)
-
: Market return
-
: Portfolio risk (standard deviation)
-
: Market risk
The Capital Market Line is used to build an efficient portfolio — one that gives maximum return for a given level of risk.
CAPM – Capital Asset Pricing Model
The CAPM is one of the most famous models in finance. It helps us calculate the expected return of a stock, based on how risky it is compared to the market.
📌 What is it?
"The more risky an investment is, the more return investors expect."
📊 CAPM Formula:
Where:
-
: Expected return of stock
-
: Risk-free rate
-
: Market return
-
: Beta of the stock (how volatile the stock is compared to the market)
🧠 In simple terms:
-
Suppose Bank FD gives you 5% (risk-free).
-
You want to invest in a risky stock — CAPM helps you find out how much extra return (risk premium) you should get.
-
The more volatile the stock (higher beta), the more return you should expect.
📌 Example:
-
, ,
So, if you're taking more risk, you deserve more return!
APT – Arbitrage Pricing Theory
APT is like a more flexible version of CAPM.
📌 What is it?
APT says that a stock’s return is influenced by multiple factors, not just the market.
🧠 In Simple Language:
- CAPM says: 🧍“Stock depends on one thing — the market.”
- APT says: 👥“Stock depends on many things — interest rates, inflation, oil prices, GDP, etc.”
📊 APT Formula:
Where:
-
: Expected return
-
: Risk-free rate
-
: Risk factors (e.g. inflation, GDP)
-
: Sensitivity to each factor
Example:
Let’s say the price of a stock depends on:
-
Inflation
-
Interest rate
-
Industrial growth
APT allows you to include all 3 in one model to calculate the return.
Comparison Table: CAPM vs APT
| Feature | CAPM | APT |
|---|---|---|
| Risk Factors | Only 1 (Market) | Multiple (macro factors) |
| Simplicity | Very simple & widely used | More flexible but complex |
| Practical Use | Good for general return estimate | Good for advanced risk modeling |
| Formula | Single beta | Multiple betas |
| Concept | What It Tells You | Main Use |
|---|---|---|
| Capital Market Line | Best return per unit of total risk | Portfolio construction |
| CAPM | Return expected from a risky asset | Stock valuation, pricing |
| APT | Return from multiple risk factors | Detailed investment analysis |