
Data Warehouse
Overview of Data Warehousing
In today’s world, organizations generate a huge amount of data every day from different sources such as sales systems, banking software, websites, mobile apps, and ERP systems. This data is scattered, unorganized, and stored in different formats.
Data Warehousing is a technique used to collect, store, integrate, and manage large volumes of data from multiple sources in one central place so that meaningful analysis and decision-making can be done.
Simply put: Operational systems run the business, while data warehouses help analyze the business.
Definition of Data Warehouse
A Data Warehouse is a centralized repository that stores integrated, historical, and subject-oriented data to support decision-making and reporting.
Key Characteristics
| Feature | Meaning (Simple Language) |
|---|---|
| Subject-oriented | Data is organized by topics like sales, customers, finance |
| Integrated | Data comes from multiple sources and is made consistent |
| Time-variant | Stores historical data (years/months/days) |
| Non-volatile | Data is not frequently changed or deleted |
Data Warehousing Components
A data warehouse system is made up of several important components that work together.
Major Components Explained
| Component | Description |
|---|---|
| Data Sources | OLTP systems, databases, ERP, CRM, files, APIs |
| ETL Tools | Extract, Transform, Load data into the warehouse |
| Staging Area | Temporary storage before data is cleaned |
| Data Warehouse Database | Central storage of processed data |
| Metadata Repository | Stores data definitions and rules |
| OLAP Tools | Used for analysis and reporting |
| Front-End Tools | Dashboards, reports, data visualization |
Building a Data Warehouse (Step-by-Step)
Building a data warehouse is a systematic process.
Step 1: Requirement Analysis
- Identify business needs
- Decide what data is required
- Understand reporting requirements
Step 2: Data Source Identification
- Identify operational databases
- Understand data formats and structures
Step 3: ETL Process
- Extract data from sources
- Transform data (clean, remove duplicates, standardize)
- Load data into the warehouse
Step 4: Warehouse Design
- Choose schema (Star or Snowflake)
- Design fact tables and dimension tables
Step 5: Data Storage
- Store historical and summarized data
- Optimize for fast querying
Step 6: Testing and Deployment
- Validate data accuracy
- Deploy warehouse for users
Warehouse Database
The Warehouse Database is the core of the data warehouse where all cleaned and integrated data is stored.
Types of Tables Used
| Table Type | Purpose |
|---|---|
| Fact Table | Stores quantitative data (sales amount, quantity) |
| Dimension Table | Stores descriptive data (customer, time, product) |
| Aggregate Table | Stores summarized data for faster queries |
Schema Types
| Schema | Description |
|---|---|
| Star Schema | Simple design, one fact table connected to dimensions |
| Snowflake Schema | Normalized dimensions, complex structure |
| Galaxy Schema | Multiple fact tables |
Mapping the Data Warehouse to a Multiprocessor Architecture
To handle large volumes of data efficiently, data warehouses are mapped to multiprocessor systems.
Why Multiprocessor Architecture?
- Faster query processing
- High scalability
- Better performance for large datasets
Types of Multiprocessor Architectures
| Architecture | Description |
|---|---|
| Shared Memory | All processors share the same memory |
| Shared Disk | Each processor has its own memory but shares disk |
| Shared Nothing | Each processor has its own memory and disk |
How Mapping Works
- Data is partitioned across processors
- Queries are executed in parallel
- Results are combined for final output
Advantages of Data Warehousing
| Benefit | Explanation |
|---|---|
| Better decision-making | Uses historical and integrated data |
| Faster queries | Optimized for analysis |
| Data consistency | Single version of truth |
| Business intelligence | Supports forecasting and trends |
Real-Life Example
Example: Retail Company
- Sales data from multiple branches
- Customer data from CRM
- Inventory data from ERP
All data is stored in a data warehouse
Managers analyze sales trends, customer behavior, and inventory needs
Summary (Exam-Friendly)
- Data Warehousing stores large historical data
- Helps in analysis, not daily transactions
- Uses ETL process
- Organized using fact and dimension tables
- Supports parallel processing using multiprocessor architecture
Difference Between Database System and Data Warehouse
Multidimensional Data Model, Data Cubes, Star, Snowflake, Fact Constellation Concepts
Difference Between Database System and Data Warehouse
This is a very important MCA exam question and is often asked in table form.
| Basis | Database System (OLTP) | Data Warehouse (OLAP) |
|---|---|---|
| Purpose | Daily operations | Analysis & decision making |
| Data Type | Current, real-time data | Historical data |
| Data Size | Small to medium | Very large |
| Updates | Frequent insert, update, delete | Rarely updated |
| Queries | Simple queries | Complex analytical queries |
| Users | Clerks, staff | Managers, analysts |
| Example | Banking transaction | Sales trend analysis |
| Performance | Optimized for speed of transactions | Optimized for reporting |
| Data Structure | Highly normalized | Denormalized |
In simple words:
- Database = runs the business
- Data Warehouse = analyzes the business
Multidimensional Data Model
The Multidimensional Data Model is used in data warehouses to represent data in multiple dimensions (views).
Key Elements
| Element | Meaning |
|---|---|
| Fact | Numeric data (sales, profit) |
| Dimension | Descriptive data (time, product, location) |
| Measure | Values stored in fact table |
Example
Sales can be analyzed by:
- Time (Year, Month)
- Product
- Region
Data Cubes
A Data Cube is a logical representation of multidimensional data.
Explanation in Simple Language
Think of a cube where:
- X-axis = Product
- Y-axis = Location
- Z-axis = Time
Each cell shows sales value.
Operations on Data Cube
| Operation | Meaning |
|---|---|
| Roll-up | Summarize data |
| Drill-down | View detailed data |
| Slice | Select one dimension |
| Dice | Select multiple dimensions |
| Pivot | Rotate cube view |
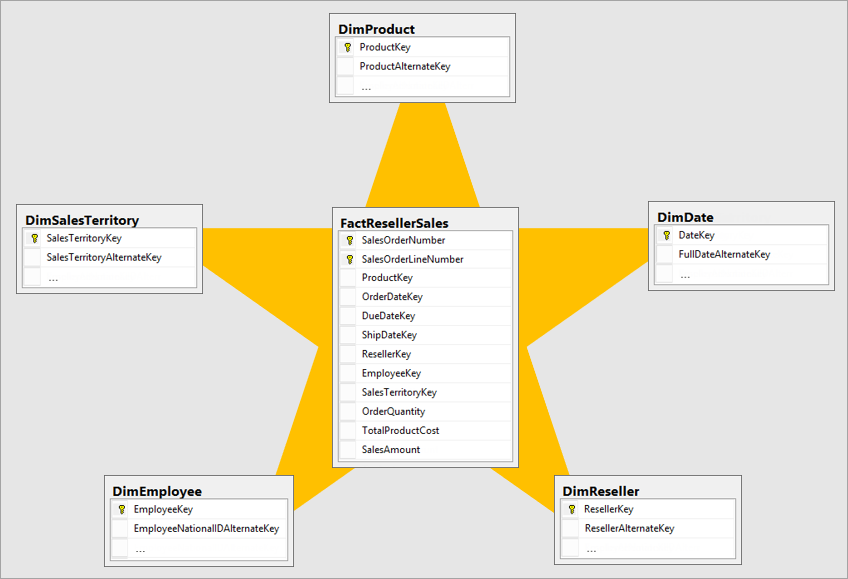
Star Schema Concept
The Star Schema is the simplest and most commonly used schema in data warehouses.
Structure
- One Fact Table in the center
- Multiple Dimension Tables around it
- Shape looks like a ⭐ star
Advantages
| Advantage | Reason |
|---|---|
| Simple design | Easy to understand |
| Fast queries | Fewer joins |
| Easy maintenance | Simple structure |
Snowflake Schema Concept
The Snowflake Schema is an extension of the star schema with normalized dimensions.
Key Features
| Feature | Description |
|---|---|
| Normalized | Dimension tables are split |
| Complex | More joins required |
| Storage | Less redundancy |
Star vs Snowflake (Quick View)
| Basis | Star Schema | Snowflake Schema |
|---|---|---|
| Complexity | Low | High |
| Joins | Fewer | More |
| Storage | More | Less |
Fact Constellation (Galaxy Schema)
A Fact Constellation schema contains multiple fact tables sharing common dimension tables.
Example
- Fact Tables: Sales, Shipping
- Shared Dimensions: Time, Product, Location
Characteristics
| Feature | Description |
|---|---|
| Fact Tables | More than one |
| Complexity | High |
| Usage | Large enterprises |
| Flexibility | Very high |
Concept Summary (One-Look Revision Table)
| Concept | Meaning |
|---|---|
| Database System | Handles daily transactions |
| Data Warehouse | Supports analysis |
| Multidimensional Model | Data viewed from many angles |
| Data Cube | Logical multidimensional structure |
| Star Schema | Simple fact-dimension design |
| Snowflake Schema | Normalized dimension design |
| Fact Constellation | Multiple fact tables |
Exam-Friendly Conclusion
- Data Warehouse is read-oriented
- Uses multidimensional data model
- Data cubes improve analytical queries
- Star schema is simplest
- Snowflake reduces redundancy
- Fact constellation supports complex analysis
This is a well-structured article that clearly explains the core concepts of data warehousing and its role in supporting organizational decision-making. The discussion on data integration, historical data storage, and analytical processing helps readers understand how businesses can transform raw data into valuable insights. The article provides a strong foundation for learning modern data management practices.
ReplyDeleteThank you for your thoughtful feedback! 😊
DeleteWe're delighted that you found the article well-structured and informative. Data warehousing plays a crucial role in helping organizations convert vast amounts of data into meaningful insights, and our goal was to present these concepts in a clear and practical way.
Your appreciation of the sections on data integration, historical data storage, and analytical processing means a lot to us. We look forward to continuing to share valuable content that helps learners and professionals strengthen their understanding of modern data management and business intelligence.
Thank you for reading and supporting PratapSolution!